Fleet Observability
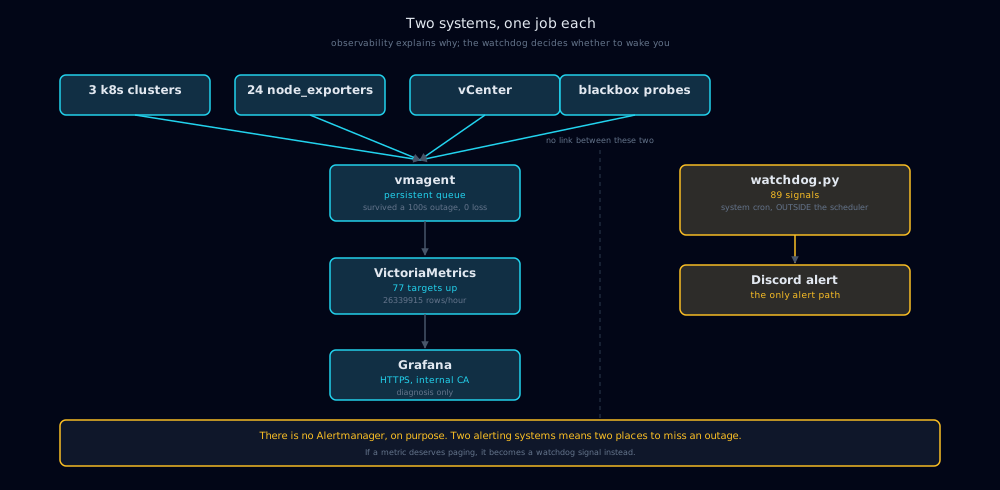
76 scrape targets feeding a metrics stack that is deliberately not allowed to page me, because alerting stays in one place.
Every figure above is measured or read from the running system.
Technology Stack
The distinction the design is built around
A watchdog answers 'is it broken?'. Observability answers 'why, and what changed?'. Those are different jobs and I deliberately did not merge them.
The existing watchdog stays the only alerting path: it runs outside the agent scheduler it monitors, fails closed, and carries stable signal IDs I can cite. The metrics stack installs no Alertmanager at all. If a metric deserves to page someone it becomes a watchdog signal instead. Two alerting systems means two places to miss an outage.
Hosted where it can survive what it watches
The collector does not run inside the clusters it observes. A production outage would take out the dashboard showing the outage, the same reasoning that keeps the watchdog outside the scheduler it monitors.
It also did not go on the existing monitoring host, which had 25 GB free on a 40 GB disk and was already the single place everything was watched from.
A metric that changed what I believed about the storage
The most valuable series is etcd write-ahead-log fsync latency. Every virtual machine in the lab sits on one NFS datastore backed by a four-wide RAID0 array on a 2010-era server, and etcd is the most latency-sensitive thing running on it.
A spot check with fsync() in a loop had suggested about 3.5 ms at the median, which looked comfortable. etcd's own histogram puts the 99th percentile at 13.63 ms on dev and 12.74 ms on production, against a 25 ms budget. Still inside the limit, but with much less headroom than the spot check implied, and now trended rather than guessed.
Exposing it required a config change and a rolling control-plane restart, because RKE2 binds the etcd metrics port to localhost by default. I rolled one node at a time and waited for the API to report ready between each; production and dev held quorum throughout, and staging, which has a single etcd member, was briefly unavailable, which I planned for rather than discovered.
Verifying dashboards the way a browser does
A dashboard that loads with empty panels is the visual form of a green check that means nothing, so I verified by executing every panel's query through Grafana's own datasource proxy and asserting each returned a non-empty series.
That caught a real bug. One panel rendered blank while both halves of its expression returned 23 series each. The left side carried environment and role labels that the aggregated right side did not, and a binary operation between them requires an exact label-set match, so the join produced nothing. My first guess at the cause was wrong and the redeploy proved it still empty; the fix only came from testing candidate expressions directly against the database.
Watching the watcher
An unmonitored monitoring system is the exact failure shape I built this to catch, so the collector has its own signals, including one that checks rows are actually being written, not merely that targets look healthy. A scraper can report every target up and still store nothing if its write path is broken.
The remote-write buffer is on disk rather than in the container, and I proved it by stopping the database for one hundred seconds while scraping continued. The queue grew from 57 bytes to 7.7 MB and flushed on recovery with no gap in the series: every node had exactly twelve samples across the outage window, which is what a thirty-second scrape interval should produce.