Homelab Infrastructure
A 7-host vSphere cluster that runs everything else on this page, managed through the vCenter API rather than the web UI.
Every figure above is measured or read from the running system.
Technology Stack
What it is
A seven-host ESXi cluster under vCenter 8, totalling 132 physical cores and 608 GB of RAM, of which 257 GB is actually in use. It currently runs 46 powered-on VMs out of 53 defined. These figures were read from the vCenter API, not estimated.
It is the substrate for the Talos platform, the data pipeline, and the build and automation hosts behind my other projects.
Managed through the API, with a scoped service account
Day-to-day operations go through the vCenter API rather than the web client. Automation authenticates as a dedicated service account bound to a custom role, and its mutating permissions are scoped to a single VM folder, so an automation bug can damage a sandbox rather than the estate.
Least privilege is easy to endorse and slightly annoying to implement, which is exactly why it is worth doing on your own infrastructure first. Getting the role definition wrong at home costs an afternoon.
Remote access with no inbound ports
Nothing in the lab is exposed by port forwarding. External access runs over Cloudflare tunnels, so the lab makes outbound connections and there is no inbound attack surface on my home IP.
What the hardware can and cannot do
Capacity planning on used enterprise hardware needs measurement, not spec sheets. Guests here report no AVX2, which looks like an EVC baseline masking it. It is not. The hosts are Sandy Bridge and Ivy Bridge, and AVX2 arrived with Haswell, so the instruction set is physically absent and no cluster setting can expose it.
That distinction decides real questions. Measured memory bandwidth in a guest is about 6.7 GB/s, roughly 140 times slower than a discrete GPU, so local model inference on this fleet is not viable at any RAM size. The cluster is idle at around 7 percent CPU with 42 percent of memory in use, but idle capacity is only useful for work the silicon can actually do: I/O bound, parallel, latency tolerant.
The scripts that produced those measurements are in the linked repository, so the claim is checkable rather than asserted.
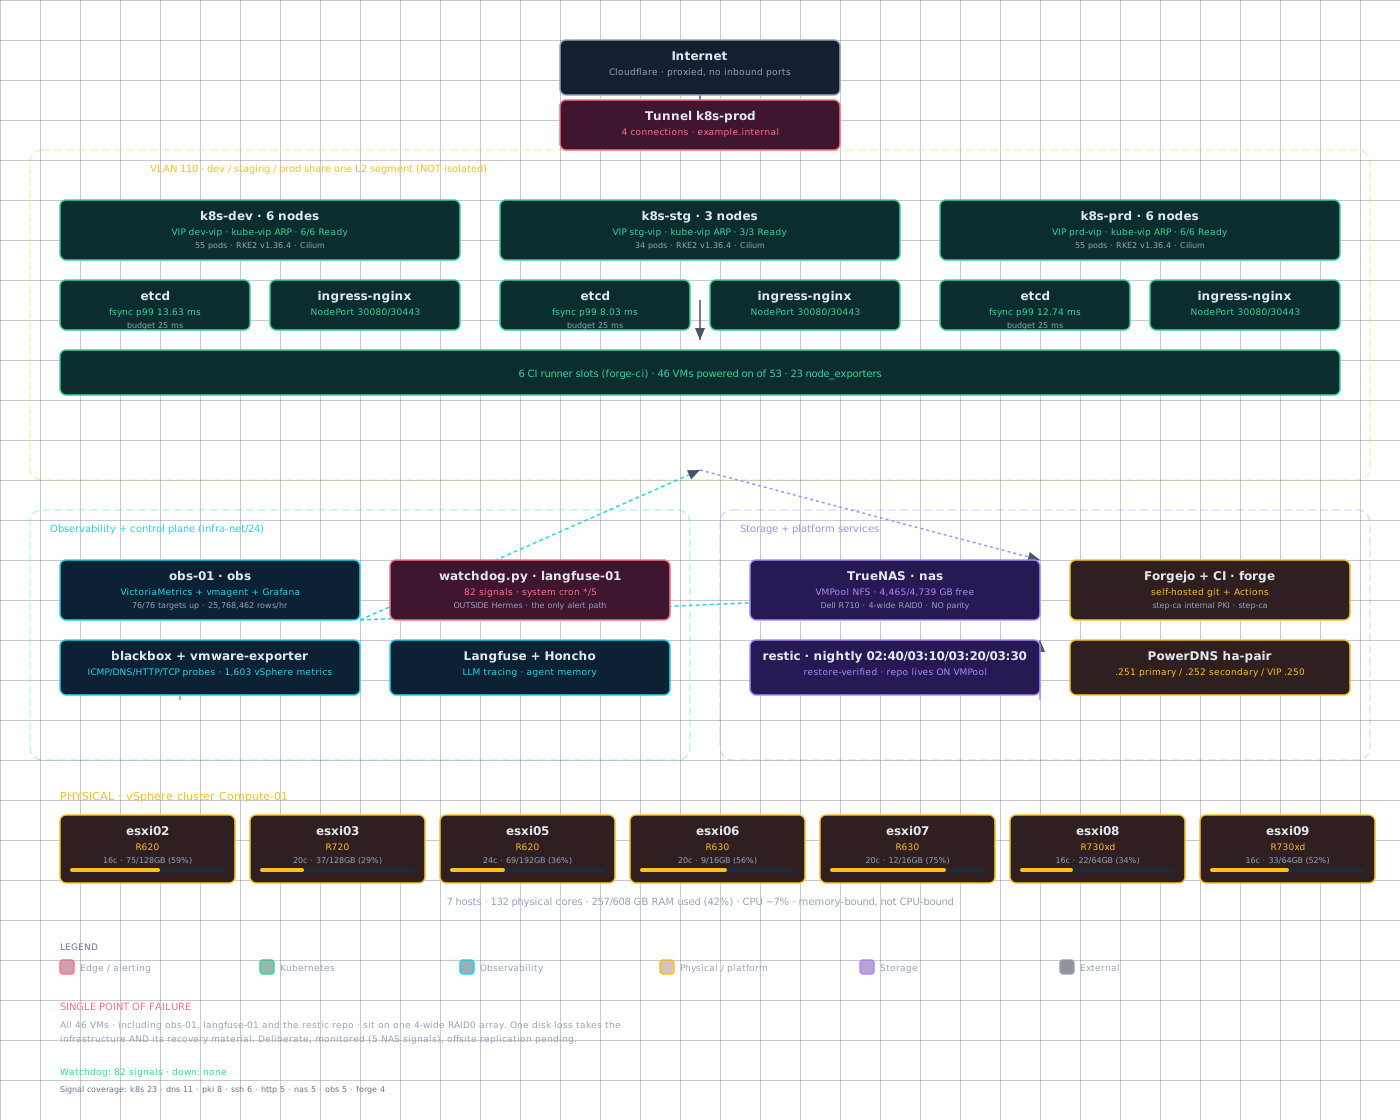
The whole estate, drawn from the live APIs
This diagram is generated, not drawn. A script queries vCenter for hosts and virtual machines, the three Kubernetes clusters for node and pod counts, the metrics database for scrape target counts, and the watchdog for its signal inventory, then renders the result. Every number in it was read at render time.
That matters because hand-drawn architecture diagrams rot within weeks. This one is re-runnable: if a cluster gains a node or a monitoring target disappears, regenerating the file shows it. Internal addresses are replaced with role names, which is the only edit made for publication.